Tyranny of the TSH
The Tyranny of the TSH
Let’s talk about further thyroid testing. In an effort to reduce laboratory costs and find ever cheaper methods of evaluating thyroid function, the TSH has become the more commonly accepted first line test with “reflex” follow-up.
Now this assumes three very important concepts.
- The feedback mechanism between the pituitary and the thyroid is intact and functional.
- It assumes a “normal distribution.” That is, a typical “bell shaped” curve of all values from low to high.
- That we can assign “reasonable” upper and lower cut-off values.
Idealized Thyroid Feedback
Refer to figure 1. You can see that TSH is part of a functional feedback loop. High values infer hypothyroidism (under-active thyroid) and low values infer hyperthyroidism (over active thyroid). The TSH values are opposite (inverse) to thyroid activity. A compensatory mechanism.
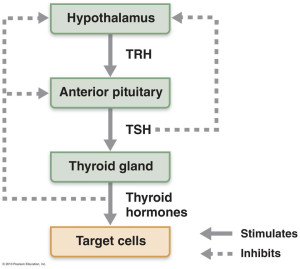
But there is human variation. It is an idealized loop that is not as precise as an integrated circuit. A result of overly simplified mechanistic thinking. There are rare situations where hypothalamic dysfunction can cause very low TSH levels rather than feedback from low thyroid activity. This is termed central hypothyroidism.
We have steadfastly maintained over the last 15 years that complete thyroid analysis should include a TSH, free T4 and a free T3. Frequently adding the reverse T3 and thyroid antibodies. Refer to our previous post. The TSH is a poor measure of free T3 — the active metabolite or driver of metabolic function.
What is a Normal Distribution?
Laboratory values are commonly assumed to fall in a “normal distribution.” That is a typical bell shaped curve. Usually, choosing 2 standard deviations (2 sigma) above and 2 standard deviations below as your typical cut-off points for abnormally high or abnormally low lab results. Representing 95% confidence limits.
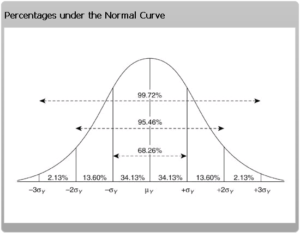
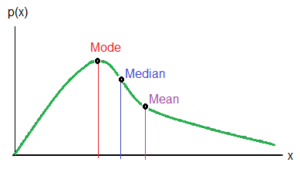
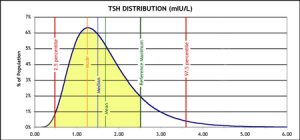
But empirical data produces a TSH curve that is skewed to the right. This is not a normalized curve. Refer to figure 3. A skewed curve produces different mean, median, mode values. These are various representations of “an average.” The mode is the most common or highest frequency value. The “average” or mean becomes less descriptive with a skewed curve
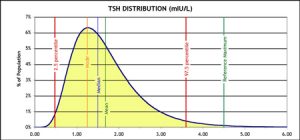
Now refer to an empirically derived TSH skewed curve. Typical upper lab limits was 5.5. More recently refined downward to 4.5 (the green line). Look at the spread from these upper limits from the real mode. The upper cut-off value is still unrealistic. The yellow represents the population AUC (area under the curve).
the upper limit (green line) should be redefined. See the contraction of the AUC population? That would mean less “normal’s” or more individuals classified as hypothyroid.
How to Reassign New cut-off values
The statistical dilemma is choosing values that includes a healthy population. Too wide and you exclude more abnormal’s. Too narrow and you include too many abnormal’s.
As far back as 2002, various standards committees including the American Society of Clinical Pathologists and others had recommended narrowing these limits to more accurately reflect the true incidence of hypothyroidism in a general population. The upper recommended value was 2.5 not 5.5. Why haven’t we ever adopted these recommendations? There is just too much resistance to redefining the true incidence of hypothyroidism. So we define a class of “subclinical ” hypothyroidism to explain these discrepancies.
Enter Economic Medicine
Let’s make sense of these elements. TSH is poorly representative of T4 or T3 values. The curves are skewed and not normalized. The cut-off values are unrealistic. The TSH alone will totally miss the diagnosis of Hashimoto’s auto-immune thyroiditis.
Now add economic imperatives of the new medicine. Let’s try to test as little as possible with the fewest tests necessary. Picking one test to represent an entire set of values. It’s folly. It’s the HMO way. It’s the Medicare – CMS (Centers for Medicare Services) way. Where “unnecessary” ordering of tests is now illegal and subject to prosecution.
Ask for More Thorough Testing
When I was in training, long ago, we were taught to leave no stone un-turned. A facetious saying at the time was “doctor, what was the serum porcelain value?” We were taught to be thorough and unrelenting in our investigations. That was the medical rounds approach. The only path to solving the problem. This has all changed — for the worse.
So contrary to current guidelines, you should have a TSH, a Free T4 and a Free T3, with clinical judgement. What is the patient saying. What is the lab saying? The art of medicine. We can do better. It’s your basic metabolism, immune system, mood, digestive efficiency and energy that is at stake.
2 thoughts on “Tyranny of the TSH”
All conventional medicine conforms to “the standard of care.” Unfortunately, the standard of care may not be creative or inclusive enough. This is a centuries old dilemma. Certainly Galileo and Semmelweis faced very similar consequences as a result of acceptable thought of the day. New breakthroughs and evolution of medical thinking are most often the result of challenging current assumptions. Even Michelangelo faced grave consequences by secretly dissecting cadavers to more accurately understand underlined human anatomy
By dossier, what do you mean?
Thank you so much for this good piece of work.
I’m compiling a ‘dossier’ to reflect that which has been and still is being done to me and so many others, in light that many of the honourable UK doctors involved in this field… expediency via capricious cruelty is the order of the day here.